
EigenLayer's restaking TVL has surged past $25B, powering Ethereum's shared security model as ETH holds steady at $2,082.10 amid 2026's volatile markets. Yet beneath this yield-chasing frenzy, eigenlayer restaking risks loom large: correlated slashing cascades threaten to wipe out billions, while DeFi leverage via liquid restaking tokens (LRTs) stacks the deck for systemic meltdowns. Slashing went live on mainnet in April 2025, turning hypotheticals into harsh realities for validators juggling multiple Actively Validated Services (AVSs).
Picture this: a single AVS outage cascades across interconnected protocols because stakers reuse the same ETH collateral. That's the core of ETH slashing cascades. When one service faults, penalties propagate, slashing shared stakes and triggering forced liquidations in leveraged positions. Recent analyses warn that each new restaking layer multiplies slashing conditions, creating a domino effect where one validator's slip-up dooms dozens.
Dissecting Correlated Slashing in Shared Security
EigenLayer's genius lies in eigenlayer shared security 2026, letting stakers secure AVSs beyond Ethereum consensus with their existing stakes. But precision demands we model the perils. Denote R_slashing as the baseline Ethereum consensus risk; restaking stacks additional vectors: R_AVS1, R_AVS2, etc. Correlated failures amplify total exposure via covariance, if AVSs share operators or oracle dependencies, a systemic shock like 2025's Ethereum volatility (sparking $900M CEX liquidations) hits them all.
Validators face compounded losses: a 5% slash on one AVS balloons to 20-30% effective penalties across portfolios. Data from BlockEden highlights how LRTs have baked in $5B leverage, mirroring pre-2008 CDO opacity. Transparency erodes as nested positions obscure true risk, setting up ethereum restaking vulnerabilities for 2026 cascades.
LRTs Fuel Restaking Leverage DeFi Inferno
Restaking leverage defi exploded with LRTs, letting users mint tokens against restaked ETH for further DeFi plays. Yield farms, lending protocols, and perps now ride these derivatives, creating leverage-on-leverage towers. At $25B TVL, EigenLayer isn't just big, it's too big to ignore, per Mitosis University, inviting regulatory scrutiny on synthetic yields.
Consider the math: base staked ETH at $2,082.10 yields 4-5% APY; restaking bumps it to 10-15% via AVS points. LRTs supercharge to 20% and, but leverage ratios hit 5-10x in aggressive setups. A 10% ETH dip? Margin calls ripple from LRT holders to underlying pools, echoing 2025's $22M DeFi collapses. Phemex notes centralization risks too, top operators control outsized stakes, amplifying single points of failure.
Cryptonium's 2026 outlook paints cascades vividly: one AVS slash triggers LRT depegs, liquidations flood DEXs, and Ethereum's LST market buckles under redemption pressure. We're not theorizing; interconnectedness has turned restaking into a high-wire act without a net.
Ethereum (ETH) Price Prediction 2027-2032
Factoring EigenLayer Restaking Risks, Correlated Slashing Cascades, and DeFi Leverage
| Year | Minimum Price | Average Price | Maximum Price | Avg YoY % Change |
|---|---|---|---|---|
| 2027 | $1,800 | $3,000 | $5,000 | +44% |
| 2028 | $2,000 | $4,500 | $8,000 | +50% |
| 2029 | $3,000 | $6,500 | $12,000 | +44% |
| 2030 | $4,000 | $9,000 | $16,000 | +38% |
| 2031 | $5,000 | $12,000 | $20,000 | +33% |
| 2032 | $6,500 | $16,000 | $25,000 | +33% |
Price Prediction Summary
Despite systemic risks from restaking slashing cascades and DeFi leverage via LRTs, ETH is poised for steady growth driven by Ethereum's ecosystem resilience, governance mitigations, and adoption trends. Average prices are projected to rise progressively from $3,000 in 2027 to $16,000 by 2032, with wide min-max ranges reflecting bearish cascade scenarios and bullish adoption outlooks.
Key Factors Affecting Ethereum Price
- Correlated slashing cascades risking capital losses across AVSs
- Amplified leverage from Liquid Restaking Tokens (LRTs) mirroring CDO vulnerabilities
- Protocol Council governance to mitigate unjust slashing events
- Ethereum L2 scaling and broader DeFi adoption boosting utility
- Regulatory pressures on synthetic yields and leverage products
- Macro market cycles, including Bitcoin halvings and global economic factors
Disclaimer: Cryptocurrency price predictions are speculative and based on current market analysis. Actual prices may vary significantly due to market volatility, regulatory changes, and other factors. Always do your own research before making investment decisions.
EigenLayer's Governance Shield Against Cascades
To counter these threats, EigenLayer rolled out council-based governance in 2025. This Protocol Council, Ethereum vets and restaking OGs, vets slashing proposals, vetoing unjust penalties. Unique Stake Allocation lets operators ring-fence assets per AVS, curbing propagation. Operator Sets further isolate risks, boosting capital efficiency without full correlation.
Yet skepticism persists. Councils introduce centralization vectors; what if capture occurs? DL News flags shifting risk-to-return as slashing live alters incentives. Validators must now price in multi-protocol exposure, potentially curbing TVL growth. For swing traders like me, charts scream caution: ETH at $2,082.10 tests resistance, but restaking volatility indicators flash red on leverage buildup. Dive deeper into slashing mechanics via our guide at /understanding-slashing-risks-in-eigenlayer-restaking-protocols.
Traders eyeing restaking leverage defi must recalibrate. Diversify across uncorrelated AVSs, cap LRT exposure at 20% of portfolio, and deploy custom indicators tracking operator concentration and slash signals. My swing setups flag entries when ETH's $2,082.10 bounces off 50-day EMAs with low leverage ratios; exits trigger on AVS fault alerts.
Quantifying 2026 Cascade Scenarios
To stress-test ethereum restaking vulnerabilities, simulate cascades: baseline 1% AVS slash on $25B TVL erodes $250M. Correlation factor of 0.7 across top operators? Losses balloon to $1.75B, per Intellectia AI models. Layer in 5x LRT leverage, and a 10% ETH drop to $1,873.89 sparks $10B in liquidations, rivaling 2025's DeFi carnage. QuickNode's L2 integrations exacerbate this, as rollup downtime feeds back into restaking penalties.
William Starr's notation nails it: total risk R_total = R_slashing and Σ R_AVS_i and Cov(R_i, R_j). High covariance from shared infrastructure turns EigenLayer's efficiency into a liability. Yet yields tempt: 15-25% APYs lure capital, but CoinBrain warns LSDfi narratives mask centralization, with top 10 operators holding 40% stakes.
EigenLayer Restaking Risks vs. Mitigations
| Risks | Impact | Mitigation |
|---|---|---|
| Correlated Slashing Cascades | 20-30% portfolio loss; cascading DeFi liquidations | Protocol Council veto; Unique Stake Allocation |
| LRT Leverage Amplification | $5B leverage creating counterparty risk; systemic failures akin to CDOs | Operator Sets; Enhanced capital efficiency and risk isolation |
| Multiple AVS Slashing Conditions | Increased validator penalties across shared stakes | Council-based governance review; Justified penalty enforcement |
| DeFi Interconnectedness | Widespread collapses from layered financial products | Robust risk management; Continuous monitoring |
Regulators circle too. Mitosis flags leverage-on-leverage as 2008 redux; synthetic yields could draw SEC probes, chilling TVL inflows. Digitap's guide underscores protocol-specific slashing terms, varying from 1-50% penalties. As ETH clings to $2,082.10, volatility spikes from oracle failures or MEV exploits could ignite the powder keg.
Ethereum Technical Analysis Chart
Analysis by Owen Maddox | Symbol: BINANCE:ETHUSDT | Interval: 4h | Drawings: 6
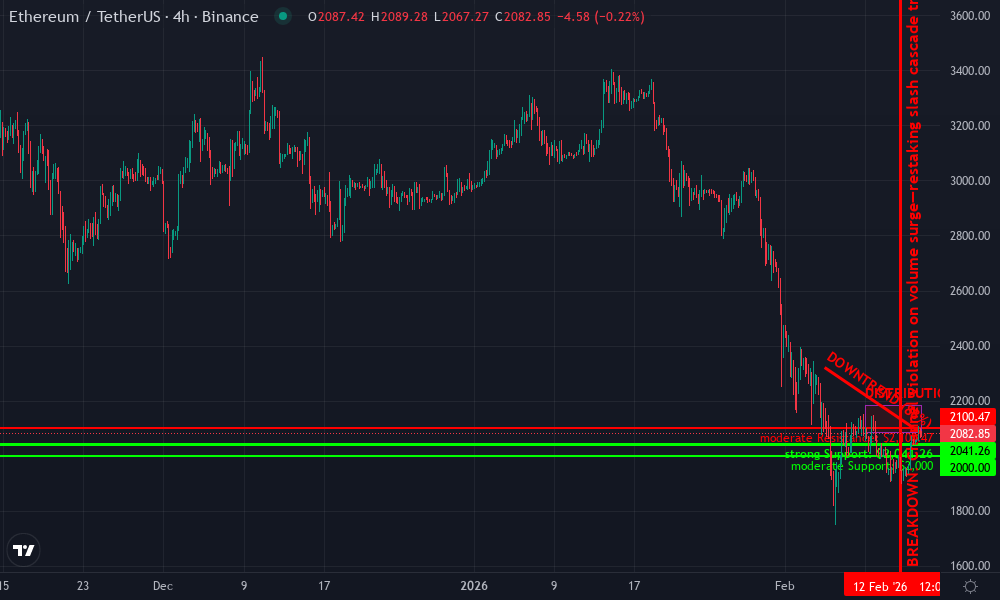
Technical Analysis Summary
Aggressively mark the dominant downtrend with a thick red trend_line from the swing high at 2026-02-05 around $2,320 to the recent low on 2026-02-14 at $2,041, extending forward to project further downside to $1,950. Overlay horizontal_lines at key support $2,041 (strong) and $2,000 (psychological), resistance at $2,100 (24h high) and $2,200 (prior consolidation top). Add fib_retracement from the Jan upswing low $1,950 (2026-01-17) to Feb high $2,320 for pullback targets at 38.2% ($2,180) and 61.8% ($2,080). Rectangle the tight consolidation zone mid-Feb 2026 between $2,080-$2,120. Place short_position marker at current $2,082 with stop above $2,110 and profit targets at $2,041 then $1,980. Arrow_mark_down on MACD bearish crossover and volume spike on downside. Callout restaking risk cascade warnings on volume bars. Vertical_line on 2026-02-12 breakdown.
Risk Assessment: high
Analysis: Elevated volatility from ETH $2,082 spot amid LRT deleveraging and slashing risks; interconnected DeFi poses cascade threat, but aggressive setups reward bold entries
Owen Maddox's Recommendation: Short ETHUSDT aggressively at $2,082, target $2,041/$1,980, stop $2,110—high risk/high reward swing play, position size 3-5% portfolio
Key Support & Resistance Levels
📈 Support Levels:
- $2,041.26 - 24h low and channel lower bound—strong defense turned breach point strong
- $2,000 - Psychological round number, prior monthly low cluster moderate
📉 Resistance Levels:
- $2,100.47 - 24h high, fib 38.2% retrace—weak bounce magnet moderate
- $2,200 - Prior consolidation lid, volume shelf weak
Trading Zones (high risk tolerance)
🎯 Entry Zones:
- $2,082.1 - Aggressive short entry on downtrend channel retrace amid restaking risk headlines, high conviction bear continuation high risk
- $2,180 - Risky long scalp on fib 38.2% bounce failure for quick dump high risk
🚪 Exit Zones:
- $2,041 - First profit target at 24h low/support breach 💰 profit target
- $1,980 - Extended target on channel projection and psych low 💰 profit target
- $2,110 - Tight stop above resistance/channel top 🛡️ stop loss
Technical Indicators Analysis
📊 Volume Analysis:
Pattern: spiking on downside breaks, drying on bounces—distribution signature
Volume confirms bear power: massive bars on dump from $2,320, weak on $2,082 bounce—restaking liqs fueling sellers
📈 MACD Analysis:
Signal: bearish crossover below zero line, momentum divergence fading
MACD histogram contracting negative, signal line death cross—aggressive sell confirmation
Applied TradingView Drawing Utilities
This chart analysis utilizes the following professional drawing tools:
Disclaimer: This technical analysis by Owen Maddox is for educational purposes only and should not be considered as financial advice. Trading involves risk, and you should always do your own research before making investment decisions. Past performance does not guarantee future results. The analysis reflects the author's personal methodology and risk tolerance (high).
Restaking reshapes Ethereum, but eigenlayer restaking risks demand respect. Shared security scales DeFi, yet eth slashing cascades lurk in overleveraged shadows. Swing with precision: let indicators guide, cap bets, and watch operator flows. ETH's $2,082.10 resilience hints at upside, but one AVS tremor could rewrite the meta. Stay sharp, stack sats wisely.


No comments yet. Be the first to share your thoughts!